Share Market

Bar Reversal Patterns

Bar Reversal Patterns:
When a particular bar or a group of bars combined together speaks for a change in the trend a bar reversal has occurred. In this article different types of bar reversal patterns are described.

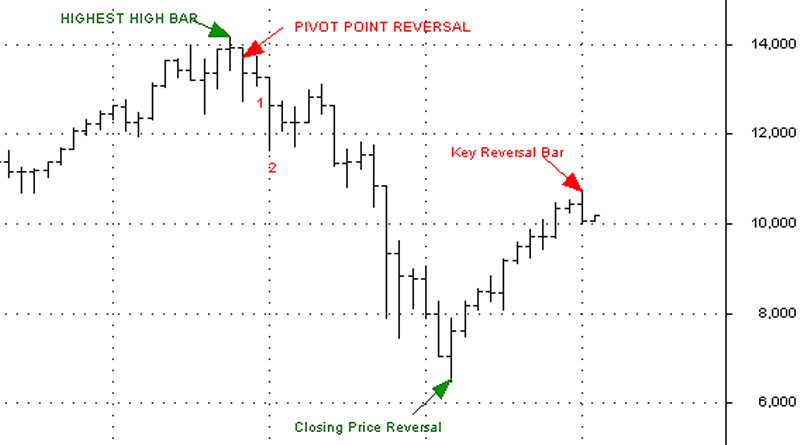
Table of Contents When a particular bar or a group of bars combined together speaks for a change in the trend a bar reversal has occurred. If is a reversal phenomenon hence, it will occur only after a prolong rise or a prolong fall. Bar reversals are of four types. Key Reversal Perfect upward bar …

Bar Reversal Patterns:

When a particular bar or a group of bars combined together speaks for a change in the trend a bar reversal has occurred. In this article different types of bar reversal patterns are described.

Read More »

Gap Theory In Stock Market:
When there is a price difference between the two consecutive days’ high and low a Gap is caused in the charts. In this article various types of gaps are discussed.

Table of Contents When there is a price difference between the two consecutive days’ high and low a Gap is caused in the charts. Gaps are of two types: – A positive gap or bullish gap or plus gap A negative gap or a bearish gap or a minus gap. If today’s low is higher …

Gap Theory In Stock Market:

When there is a price difference between the two consecutive days’ high and low a Gap is caused in the charts. In this article various types of gaps are discussed.

Read More »

Stochastic oscillator indicator:
Stochastic oscillator is a favorite indicator for traders and investors to understand overbought and oversold zone in the smaller time frame. In this article trading strategy through Stochastic oscillator is described below.

Table of Contents It is a kind of oscillator. It measures very short-term fluctuation of market and tries to identify if it is technically over bought or not or over sold for the short-term time frame. It is made up of two lines %K and %D. %K is plotted as a solid line and %D …

Stochastic oscillator indicator:

Stochastic oscillator is a favorite indicator for traders and investors to understand overbought and oversold zone in the smaller time frame. In this article trading strategy through Stochastic oscillator is described below.

Read More »

R.S.I. (Relative Strength Indicator):
R.S.I. is a favourite indicator for traders and investors to understand overbought and oversold zone in the longer time frame. In this article trading strategy through R.S.I. is described below.

RSI is an oscillator developed by Welles Wilder in the year 1974. It measures the relative strength of a particular stock over a given period of time. Calculation: – Average of 14 days higher close R.S. = ————————————————————- Average of 14 days down close 100 RSI = 100 – ( ———— ) 1 + R.S. …

R.S.I. (Relative Strength Indicator):

R.S.I. is a favourite indicator for traders and investors to understand overbought and oversold zone in the longer time frame. In this article trading strategy through R.S.I. is described below.

Read More »

Oscillators in technical analysis:
Oscillators are supposed to be known as advanced indicators in technical analysis. This article explains the significance of oscillators in share trading.

An oscillator is a technical analysis tool that constructs high and low bands between two extreme values, and then builds a trend indicator that fluctuates within these bounds. It is supposed to be known as the advanced indicator in Technical Analysis. If oscillates between the two extremes over-bought and over-sold. All the oscillators give us two …

Oscillators in technical analysis:

Oscillators are supposed to be known as advanced indicators in technical analysis. This article explains the significance of oscillators in share trading.

Read More »

Trend Following Indicator: Moving Average:
Trend-following indicators are very important in technical analysis. The moving Average is one of the trend-following indicators. The significance of the Moving Average and its calculation method as well as working system are explained in this article.

There are different types of indicators in Technical Analysis. Out of these Trend Following Indicators are very important. All trend-following indicators are lagged indicators. They generate a late signal but it is a confirm signal. The moving average is one of the trend-following indicators. It is a mathematical device which is used to understand the …

Trend Following Indicator: Moving Average:

Trend-following indicators are very important in technical analysis. The moving Average is one of the trend-following indicators. The significance of the Moving Average and its calculation method as well as working system are explained in this article.

Read More »

Theory of Retracement in Trading:
According to the Theory of Retracement, there are many retracement levels. Which levels are most important? This article answers this question.

Retracement means the correction of the previous movement. According to the theory there are many retracement levels. Out of these, the most important are the following. 33% or 1/3rd of the previous movement happens to be a crucial support or resistance level as the case may be. If the previous trend is strong enough, no …

Theory of Retracement in Trading:

According to the Theory of Retracement, there are many retracement levels. Which levels are most important? This article answers this question.

Read More »

Trend: Definition, Types, Examples, and Uses in Trading:
This article explains trend and the types of trend. Definition of Trend Line and it's measuring implication are also described here.

Table of Contents Introduction To Technical Analysis of Stock Market Definition of Trend: – The direction of the price movement in Technical Analysis is known as trend. Price line at a given point of time has to follow a particular direction which is known as trend. Price, at any point of time, can either go …

Trend: Definition, Types, Examples, and Uses in Trading:

This article explains trend and the types of trend. Definition of Trend Line and it's measuring implication are also described here.

Read More »

Scroll to Top