Stochastic oscillator is a favorite indicator for traders and investors to understand overbought and oversold zone in the smaller time frame. In this article trading strategy through Stochastic oscillator is described below.
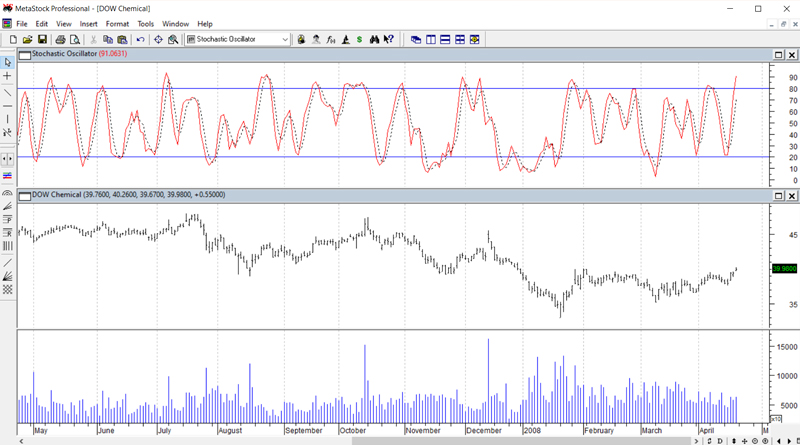
It is a kind of oscillator. It measures very short-term fluctuation of market and tries to identify if it is technically over bought or not or over sold for the short-term time frame. It is made up of two lines %K and %D. %K is plotted as a solid line and %D is plotted as doted line. We must note that %D is nothing but the derivative of %K.
Stochastic is plotted on a vertical scale between zero to hundred. Above 80 it is considered as over bought zone. Bellow 20 it is considered as over sold zone.
Trading Rule: -
In a perfect up trend %K line will be greater than %D and both will continue to rise.
In a perfect down trend %K line will be less than %D and both will continue to fall.
When both the line goes above 80 it generally identifies an overbought situation. Let us note in this connection that an overbought situation does not provide any sell signal. It only tells us that the previous rally is over stressed and correction could be round the corner. A perfect sell signal will come when both the line %K and %D bellow 80.
When both the line goes bellow 20 it tells us that the down trend has been over stressed and rally in the price is near the corner, but stochastic remain bellow 20 is not a buy signal. A buy signal will occur when both the line moves up above 20.
We must note that the zone between 20 to 80 is normally regarded as neutral zone. The direction of the stochastic line will confirm the direction of the trend.
Stochastic giving buy signal or sell signal in the neutral zone is a matter of great importance.
Divergence is stochastic do and can occur periodically. But when they occur it should not be ignored.