R.S.I. is a favourite indicator for traders and investors to understand overbought and oversold zone in the longer time frame. In this article trading strategy through R.S.I. is described below.
RSI is an oscillator developed by Welles Wilder in the year 1974. It measures the relative strength of a particular stock over a given period of time.
Calculation: –
Average of 14 days higher close
R.S. = ————————————————————-
Average of 14 days down close
100
RSI = 100 – ( ———— )
1 + R.S.
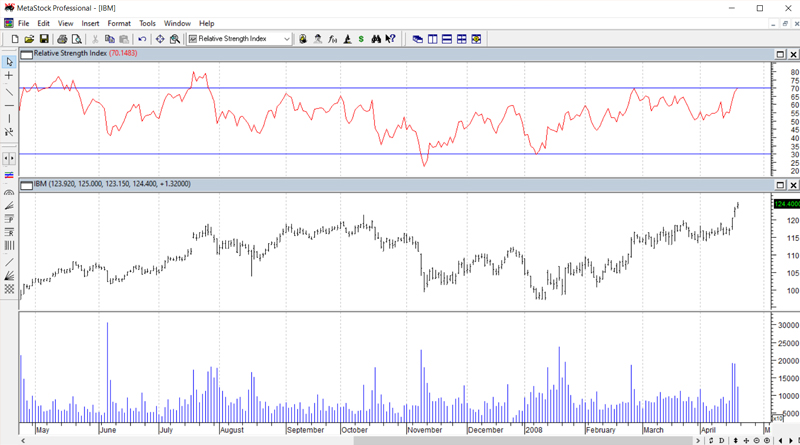
RSI is plotted on a vertical scale between zero to hundred. Bellow 30 it is called over sold zone, above 70 it is called over bought zone.
Trading Strategy: -
When RSI falls bellow 30 it indicates that the situation is over sold and a rally in the price is likely to occur. A valid signal to buy will occur when RSI goes above 30.
When RSI goes above 70 it indicates an over bought situation and a correction in the price is nearby. Let us note RSI above 70 does not trigger a sell signal RSI can remain above 70 for some time. A valid sell signal will occur when RSI comes bellow 70.
RSI is to be used for understanding the longer-term view of market. It is no use to watch RSI to understand a shorter-term view. Let us note that RSI to be used always for an investment purpose. Divergence in RSI is of major importance. Any divergence in RSI has to be carefully monitored.